$FND

I came across $FND when I was bored and step into the store in West Covina, in Los Angeles, where its kind of this large warehouse in the middle of like a run down plaza, and I had to walk in and see what this place sold. Little to my surprise it was a tiles/floor shop that is actually traded publicly - and of course, the rabbit hole began.
stats: current Price: $48.00 | 52-Week Range: $55–$104 | Market Cap: ~$5.2B | Revenue TTM: $4.68B, ~10x EV/EBITDA vs 10yr 29x. lets get into it!
Origin and founding story:
Floor & Decor was founded in 2000 by George Vincent. Vincent was renovating his home and could not find the specific tile his wife wanted at Home Depot or Lowe's. He realised the problem was not price, it was selection. Home improvement stores dedicate roughly 3,000 to 5,000 square feet to flooring within a store that sells everything. That space is not enough to carry the depth of product a serious flooring customer needs. Vincent's insight was that the only way to properly serve this customer is to specialise entirely in hard surface flooring and nothing else.
Just two years after opening the first store, FND was acquired by a group of investors including Najeti Ventures, Saugatuck Capital, and TWJ Capital when the company had only two stores. The business grew to 25 stores by 2010 when ownership changed again to Ares, Freeman Spogli, and FND management. Vincent left the CEO role at that point. Thomas Taylor, who had overseen store operations at Home Depot, joined as CEO in 2012 with the explicit goal of preparing the company for a public listing. The IPO was delayed repeatedly — there were news reports about it as early as 2014 — before finally happening in May 2017. Taylor described it directly: they kept stopping and starting because the market was not right, until they finally decided there would always be something and just went.
One critical piece of history during the PE ownership era: the early private equity owners abandoned the everyday low price model — which is the foundation of the entire business — in favour of a promotional high-low strategy where prices are marked up and then put on sale. This is what Walmart tried. It failed for both of them. The business declined. Taylor rebuilt it on EDLP from 2012 onwards. This history matters today because it establishes a direct precedent for what happens when FND's core strategy drifts. We will return to this point in the CEO risk section.
What the business is today:
FND operates retail warehouses/showrooms that sell hard surface flooring and related products exclusively. Each store is approximately 75,000 square feet, roughly the size of a large supermarket and hardware store combined. Stores carry approximately 4,000 or more SKUs of tile, stone, hardwood, laminate, luxury vinyl tile, vinyl plank, and installation accessories including grout, mortar, backer board, tools, and underlayment. The company also carries adjacent categories including countertops, vanities, faucets, shower doors, bathroom mirrors, lighting, and as of 2025 semi-custom cabinets.
The business model is warehouse retail at everyday low prices. Prices are transparent, consistent, and the same for every customer regardless of who they are. There are no promotional sales cycles, no weekend deals, no membership fees. The company sources directly from 240 manufacturers across 24 countries, bypassing agents, brokers, and distributors entirely. This direct sourcing is what makes the everyday low price promise structurally achievable, which I would argue is a strong feat in their competitive strength today. As of December 2025 the company operated 270 warehouse stores and five design studios across 39 states. Its long-term target is 500 stores. It is currently approximately halfway there, with ~250 today.
Value proposition:
Walking into a 75,000 square foot FND warehouse is a fundamentally different experience from walking into the flooring aisle of a Home Depot. At Home Depot you are in a 3,000 to 5,000 square foot section of a massive general store. At FND you are in a dedicated flooring showroom where every wall, every floor section, and every room vignette is showing you a flooring product in context. Products are displayed in room settings so you can see how a tile looks paired with a particular grout colour and a particular countertop material. Samples are available to take home. Designers are available in every store for free consultations. The store is laid out so that a homeowner doing a bathroom renovation can see the tile, the corresponding installation materials, and the adjacent products like vanities and faucets all in proximity to each other.
This layout drives the customer experience and contractor relationships, which can be challenging in a place that is smaller. As well, it drives the attachment rate for adjacent categories and installation materials.
Furthermore, each store is led by a Chief Executive Merchant, the store manager title FND uses internally. The CEM has genuine autonomy to customise the product mix, pricing strategy, visual displays, and marketing for their specific market. This is important because it means that the value to the market is specific to its local preferences and niche, creating a more unique and customized experience.
Ex: Data comparing its Pompano Beach Florida store and its Alexandria Virginia store's product mix was dramatically different reflecting local taste and demographic preferences. A standardised national chain like Home Depot might find it difficult to replicate this local merchandising intelligence without dedicating the same specialised focus to flooring.
Section 2: Who shops at FND and why?
You can really breakdown FND's customers into three buckets, however the most important is really the absolute strength they have over the business to contractor.
DIY customers: do it yourself, account for approximately 15% of total sales. These are homeowners who buy flooring products and install them without professional help. A typical homeowner changes their flooring twice in their entire life. Even the most loyal DIY customer is therefore not a meaningful source of recurring revenue. They probably are indifferent whether it is FND or HD or Lowes, they look for price and quality - as they might have a strong opinion already on what they need to be done in their homes.
BIY customers; buy it yourself, account for approximately 45% of total sales. These are homeowners who come to FND to purchase the flooring themselves but are doing so because a professional contractor has recommended either a specific product or recommended FND as the place to buy it. The contractor typically accompanies the homeowner on the store visit or gives them a specification to find in store. The homeowner pays but the contractor drives the entire decision.
Pro customers account for approximately 40% of total sales. These are the contractors themselves — flooring installers, general contractors, homebuilders, tile setters — buying directly for their projects.
~85% of customers are contractor influenced!
What really strengthens the business is the relationship with these small contractors. Given that they are not giant construction companies, they are often local business owners with a few employees who need reliable supply, fair pricing, and consistent product quality. Hence, with Pro desks, inventory help, lot matching, delivery options, and a loyalty program that encourages repeat purchases. A homeowner may only replace flooring once or twice in a lifetime, but a contractor may come back every week for many years. That is why the Pro relationship matters so much - this is not one-time consumer spending. It is recurring demand from professionals who build their business on the company’s products and service.
While a highly compelling valuepropsition - it also highlights a few key risks; 1) they are very dependent on contractors (vs HD that has more breadth of offering), 2) business is cyclical as it is strongly tied to housing - if little to zero housing turnover, like what we are experiencing currently, remodeling activities stay stale. Which is the argument to be made today as why their stock has rerated aggressively.
Another risk is that Pro customers can be more demanding and more price-sensitive than regular retail shoppers. A homeowner may buy flooring once and not know the market well. A contractor buys constantly, compares prices, expects inventory to be available, and notices immediately if service slips. If a Pro loses trust in FND on price, stock availability, or delivery, they may shift a lot of business elsewhere. That means losing one Pro relationship can hurt more than losing one casual shopper.
Section 3: Industry backdrop
While some may think this is a really boring industry, there has been some signifcant changes from the early 90s to today, that provides good tailwind for FND. In the late 1800s, painted floors and decorative tiles were common. Then carpet took over and became the standard in American homes for much of the 20th century. After that, the trend shifted again. Hardwood, tile, and other hard surface floors began taking share back from carpet. Floor & Decor was founded in 2000 at exactly the right time, as this move away from carpet was starting to gain real momentum. In many ways, the company did not create the trend. It simply positioned itself very well to benefit from it.
Carpet once made up about two thirds of the market, but now it is closer to 37% to 40%, while hard surface flooring has gained a much larger share. The reasons are easy to understand: hard surface flooring lasts longer, is easier to clean, works better for people with allergies, and has become much more affordable thanks to products like laminate and luxury vinyl tile. For Floor & Decor, this matters because the company is heavily focused on hard surface flooring. As long as consumers keep choosing tile, wood, and vinyl over carpet, the category still has room to grow. The challenge is that no one knows exactly where carpet demand will finally level out, and that makes the long term growth outlook less certain.
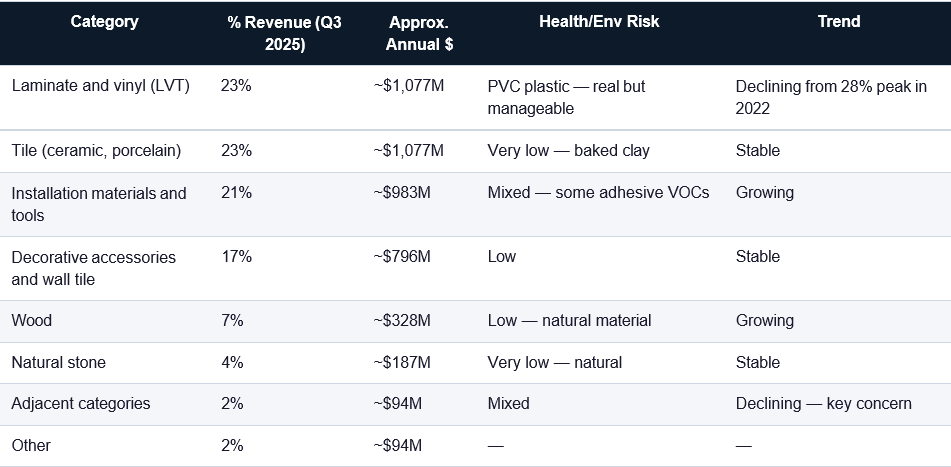
One of the biggest drivers of this shift has been LVT (luxury vinyl tile). LVT is designed to look like wood or stone, but it is much cheaper, waterproof, and easier to install (basically works like sticker but for floor). That combination has made it very popular with homeowners and contractors. It is now one of Floor & Decor’s largest product categories (25% of sales). But LVT also comes with risks. Because it is made largely from PVC plastic, there have been concerns around chemicals, indoor air quality, and environmental impact (something to be cautious about). While the industry has improved product standards and certifications, there has been a growing trend on reddit/homeimprovers digests that suggest consumers may prefer alternatives - all of which FND still carries.
Section 4: Industry
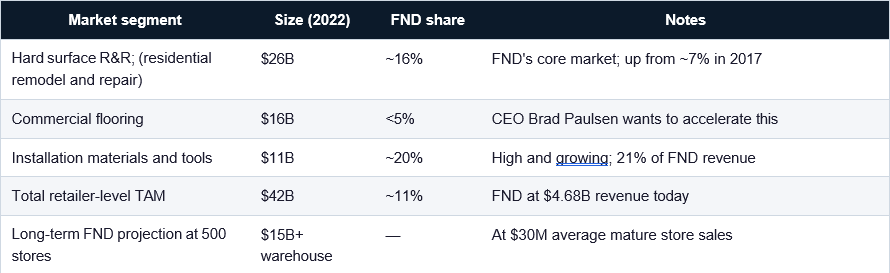
FND's market share in its core R&R; segment roughly doubled from approximately 7% in 2017 to approximately 16% by 2022. This is systematic share gain against Home Depot, Lowe's, and independent specialty retailers — all while those competitors have every incentive and resource to defend their positions.
Some stats that are holding FND back:
Existing home sales in the US fell from approximately 6 to 6.5 million units per year post-pandemic to approximately 4 million — near post-financial-crisis lows. This has been a big driver for FND's negative same-store sales over the past three years. When homes do not change hands, the renovation cycle stalls.
However there is an offsetting dynamic that partially mitigates this. Homeowners who are locked into 3% mortgages and cannot afford to move at 7% rates are not doing nothing. They might reinvest in the homes they already own (e.g., If you cannot get the larger kitchen by moving to a bigger house, you renovate the kitchen you have) - which is what management is hitting at, and why I believe they still have some good visability going-forth, as they have made more commitments to build out new distribution centers and retail channels.
As well, flooring is one of the most common and highest-ROI renovation projects. Approximately 52% of US flooring demand comes from renovation of existing homes, not from home sales transactions. That majority of demand is relatively insulated from transaction volume. Approximately 80% of US homes are more than 20 years old. Nearly half were built before 1980. Older homes need more frequent flooring replacement from wear, water damage, and style obsolescence. This creates a non-discretionary demand stream that does not disappear in downturns. At some point the floor simply needs to be replaced regardless of the homeowner's preference for timing.
Are they protected from players like Amazon?
Bill Ackman identified the conditions necessary for consumers to prefer buying online. Hard surface flooring fails nearly every one of them. The product is high-priced. It is needed relatively immediately for active projects with specific timelines. Shipping cost is high — tile is extremely heavy and fragile. The purchase is almost always part of a larger coordinated project requiring multiple products to be seen together. And the purchasing decision is heavily influenced by a professional contractor rather than just the end consumer. The ecommerce data confirms this - FND's ecommerce was approximately 17% of total sales in 2022 versus 8% in 2018. But 80% of those ecommerce orders are buy online pick up in store. 71% of customers who purchased online had visited a store first. 79% of customers who purchased in store had visited the website first. This is a pure omnichannel business where digital and physical reinforce each other. Amazon cannot offer a 75,000 square foot showroom where a designer helps you coordinate tile, grout, and countertop materials together.
Section 5: Core Strengths/Competitive Position
FND's gross margins have been stable at 41 to 45% for nine consecutive years from 2016 through 2025 (more on this in financials). This period included a global pandemic, a supply chain crisis, the fastest interest rate increase in 40 years, and sustained heavy investment by Home Depot in its flooring category, all while growing store count. The gross margin in the TTM period at 44.8% is the highest in the company's history. This could suggest that (a decade of 41-45% gross margins) Home Depot, Lowe's, online players, and specialty competitors have not materially pressured FND's pricing power.
SKU depth:
FND carries approximately 4,000 or more SKUs per store than HD/LW. Home Depot and Lowe's dedicate 3,000 to 5,000 square feet to flooring within stores of 100,000 or more square feet, carrying roughly 200 to 400 flooring SKUs each. Specialty tile stores are typically 5,000 to 20,000 square feet. FND at 75,000 to 79,000 square feet dedicated entirely to hard surface flooring carries a selection that is 10 to 20 times deeper than its closest general retail competitor.
Think about what that means from a supplier relationship angle and contractor stickiness.
1) The supplier relationships built over the past two decades may be an important source of advantage. As I heard from one manager at Floor & Decor, the company works with some niche suppliers that produce highly customized SKUs. This suggests that one of FND’s strengths is its network of strong relationships with smaller and mid sized suppliers. That allows the company to offer much greater SKU depth. It also creates an advantage because larger contractors may find it difficult and inefficient to source from many smaller suppliers on their own.
2) This matters from the Pro contractor angle as well. If a contractor has five active jobs and one of those clients wants a specific, non mainstream style that only FND can provide, the contractor may choose to buy everything from FND rather than split purchases across multiple suppliers. In that case, a rare SKU that represents only 0.01% of revenue can still be strategically important, because it helps keep a contractor’s full annual spend within the FND ecosystem instead of being spread across competitors.
The Lowe's experiment: a strong example of why it is difficult for them to push into FND's space. In 2019 Lowe's ran a test in two stores attempting to replicate the FND model. They tried to dedicate more space to flooring, increase SKU count, and source directly from manufacturers. The experiment failed. They could not dedicate enough floor space to the category and still carry out-of-stock levels adequately. Their flooring volumes alone were not sufficient to support direct sourcing relationships — their infrastructure was built for wholesalers like Shaw and Mohawk and those relationships could not be unwound for a test in two stores. They abandoned the effort.
You cannot copy FND's model without going entirely all-in on hard surface flooring as your only business. A general retailer cannot carve out a FND-equivalent department while also selling lumber, paint, plumbing, and appliances. The direct sourcing model that makes the pricing work requires flooring-specific volume that only a specialist can generate.
The market share trajectory & risk:
FND's sales as a percentage of Home Depot and Lowe's combined flooring sales went from approximately 5% in 2013 to approximately 30% in 2022. That is a six-fold increase in relative market share in nine years against the two most powerful home improvement retailers in the world with combined revenues above $200 billion. FND's share of the hard surface R&R; market went from approximately 7% in 2017 to approximately 16% by 2022 — doubling in five years in its core addressable market.
The key risk to FND is not that current competitors take share from it. The model is working and the market share trajectory confirms it, but rather, it is the category itself maintains sufficient growth, and whether FND's management stays focused on the model that produced the success.
Flooring has historically been a deflationary category. Tufted carpet saw price per square yard fall 30% between 1955 and 1965 even as volume exploded. LVT pricing has been declining as technology improves and manufacturing scales. Looking at FND's historical same-store sales drivers, average ticket price growth was very muted — barely keeping pace with inflation — until the pandemic. Most same-store sales growth came from transaction volume growth rather than pricing.
Compare this to Home Depot. Over the past decade HD's comparable customer transactions grew only approximately 20% cumulatively, but average ticket price grew approximately 65%. HD has strong average ticket growth because its customers buy increasingly expensive projects and because it has broad pricing power across many product categories. FND's customers are buying flooring — a category where technological improvement tends to push prices down over time as cheaper alternatives replicate premium aesthetics at lower cost.
If FND cannot grow average ticket meaningfully over the next decade through premiumisation, design services, or product mix shift, long-term same-store sales growth is constrained to transaction volume growth plus modest pricing. In a deflationary category that is a real limitation on the terminal value of the business. This is the most honest long-term bear argument and it is not yet resolved by the current data.
Section 6: Financials & Valuation
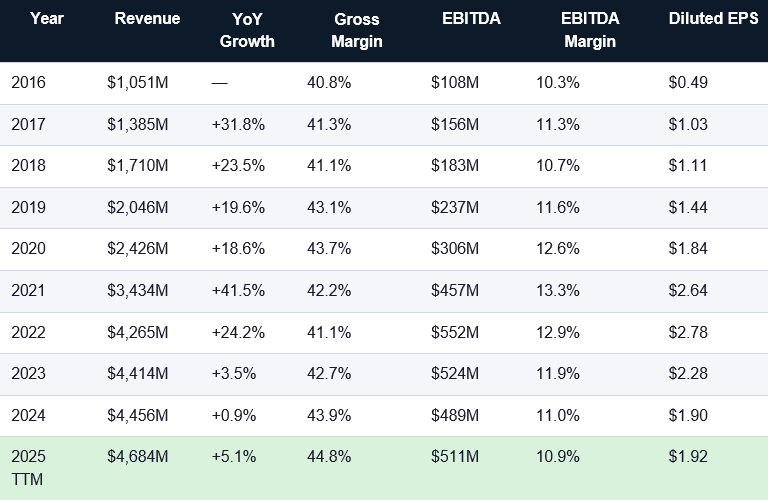
*Revenue CAGR from 2016 to 2025 was approximately 18% per year. The 2021 surge of 41.5% was the COVID nesting boom. The 2023 and 2024 near-flat periods reflect the housing market freeze caused by mortgage rate increases. 2025 re-accelerated to 5.1%. Gross margins have never been higher at 44.8% TTM — the competitive position at the product level is intact.
EBITDA Compression:
The EBITDA margin compression is explained by SG&A growing faster than revenue. SG&A went from approximately 32% of revenue in 2016 to approximately 39% of revenue in 2025. This happened because the company was investing heavily in new stores, new distribution centres, corporate infrastructure, and stock-based compensation during the most aggressive expansion phase in its history. The underlying product economics — buying and selling flooring — have never been better as evidenced by the improving gross margins. The cost structure around those product economics grew too fast relative to revenue.
SG&A; as a percentage of revenue should naturally decline as the store base matures, new store openings slow from 30 per year to 20 per year, and the fixed overhead cost base gets leveraged over a larger revenue base. Home Depot experienced the same dynamic after its expansion phase ended. This is the primary margin recovery thesis.
Segment Mix:
Capex:
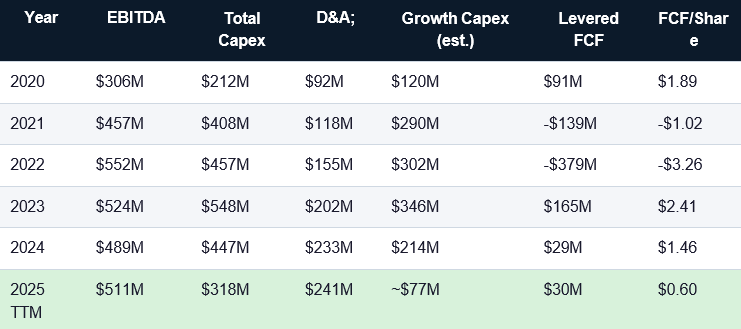
Growth capex collapsed from $346M in 2023 to approximately $77M in 2025, which is a $269M annual reduction. Additionally, management stated in Q3 2025 earnings that new store construction costs have been reduced by approximately $1.5M per store versus 2023 levels, with further improvement expected for the 2026 cohort. At 20 new stores per year that is $30M of additional annual capex savings not yet fully reflected in consensus models.
Valuation:
A reverse DCF at $48 implies 5% perpetual growth in owner earnings, only modestly above nominal GDP, for a business with 16% market share in a growing category, a proven model, approximately 250 additional store locations still to open, and a Pro customer base that appears highly sticky. That does not seem to match the actual quality of this business.
A base-case DCF using modest, sector-anchored growth of 7-8% per year yields a value of $68-76 per share. Even a more punitive scenario, assuming 6% growth and a 2% terminal rate, produces a value of approximately $51 per share.
That suggests maximum bear-case downside from $48 is about 6%. A private equity buyer targeting a 20% IRR would likely pay roughly $47-53 per share based on financial engineering alone, which creates a structural floor where the company could become a take-private candidate. The asymmetry is unusual: downside appears limited if the thesis is wrong, while upside in a base case could be 40-60% without requiring anything heroic.
For historical context, Home Depot traded at approximately 10x EV/EBIT in 2011-2012 after its own store expansion stalled and same-store sales were negative for four consecutive years. Over the following decade, with essentially no new store openings, sales per store more than doubled and the stock rerated from 10x to 18-20x. Floor & Decor appears to be at a similar inflection point, but at a lower starting multiple and with more growth runway still ahead.